
The Vergio Agentic Commerce Index
Sample sizes vary by statistic: each one counts only the stores definitively measured on that exact check this month, never estimates. See how measurement works.
Vergio Agentic Commerce Index
#71
The Vergio Agentic Commerce Index (VACI) stands at 71, measured across all of the 58,568 Shopify stores in Vergio's continuously monitored panel (August 2026).
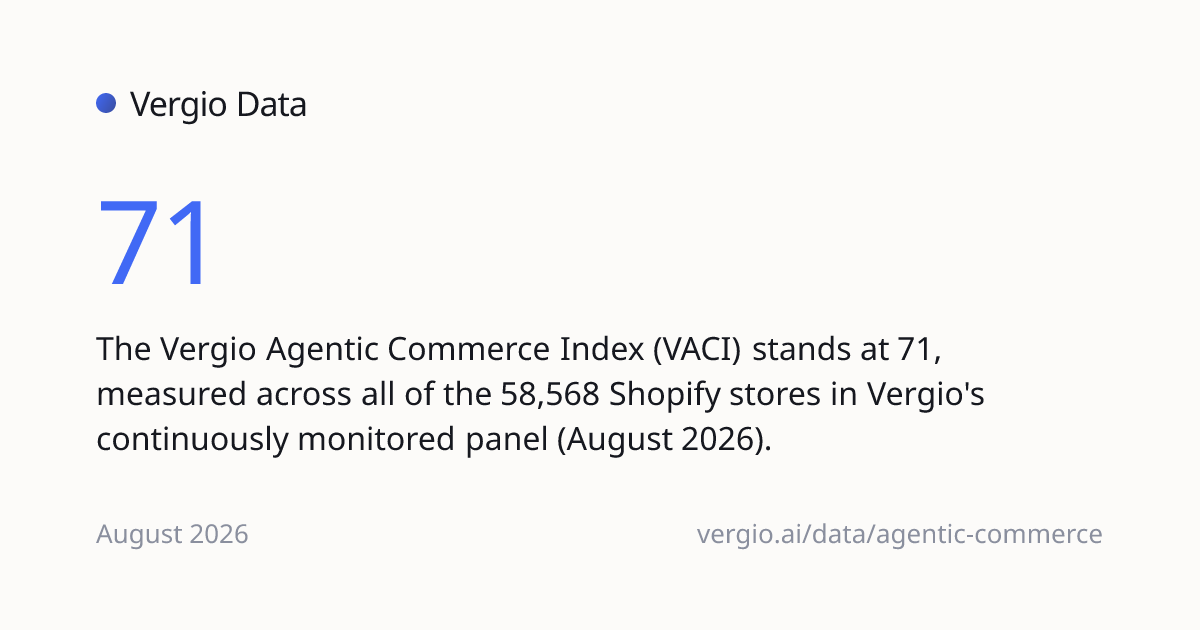
up 0.1 points vs July 2026 (constant cohort of 59,450 stores)
On this page
Crawler block rate
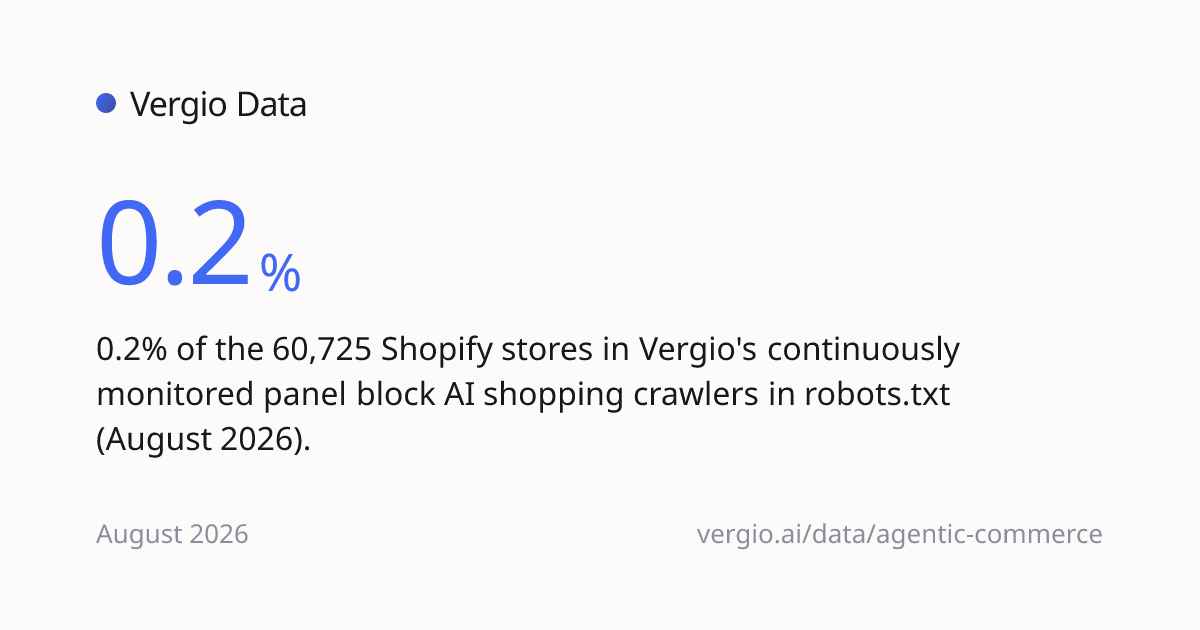
#0.2%
0.2% of the 60,725 Shopify stores in Vergio's continuously monitored panel block AI shopping crawlers in robots.txt (August 2026).
llms.txt adoption
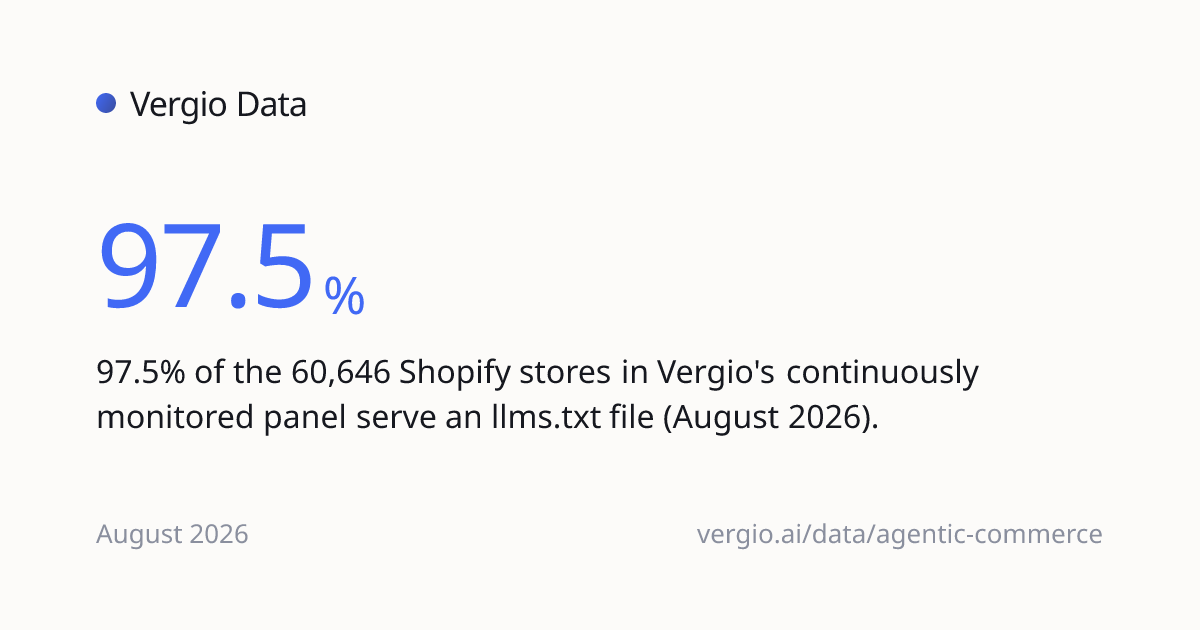
#97.5%
97.5% of the 60,646 Shopify stores in Vergio's continuously monitored panel serve an llms.txt file (August 2026).
Product schema adoption
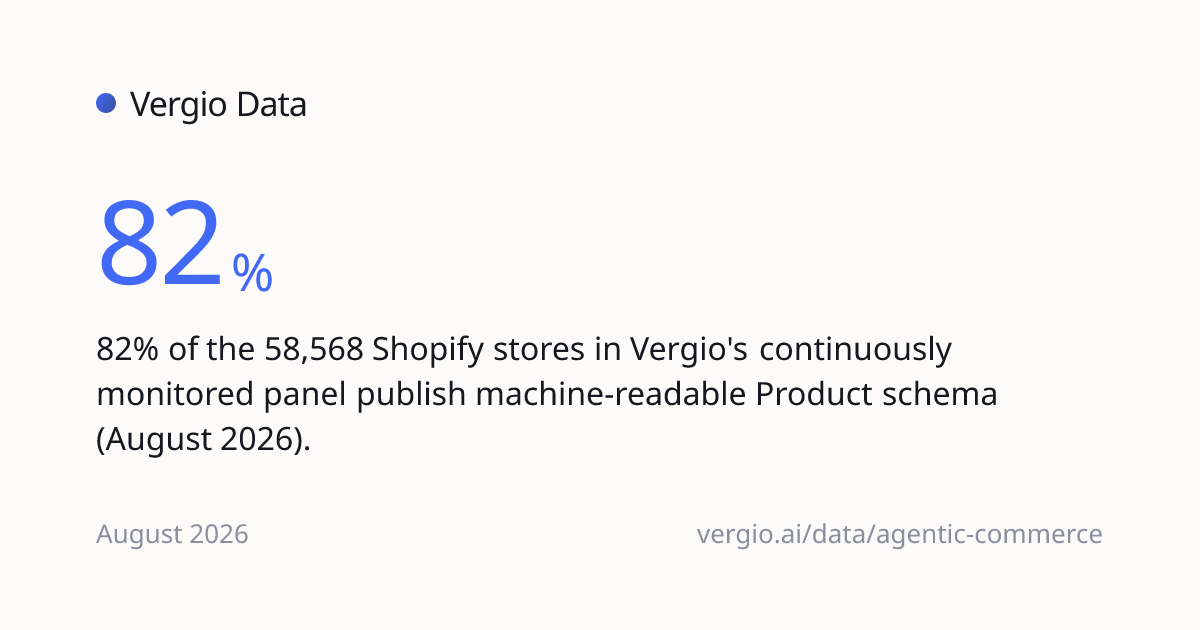
#82%
↑ 0.2 points (constant cohort of 59,450)
82% of the 58,568 Shopify stores in Vergio's continuously monitored panel publish machine-readable Product schema (August 2026).
Per-vertical breakdown
#The four facet rates and the Agent-Ready rate, split by the vertical Vergio classifies each store into (August 2026).
| Vertical | Blocks AI | llms.txt | Product schema | FAQ schema | Agent-Ready |
|---|---|---|---|---|---|
| activewear | 0% | 99% | 84% | 2% | 83.8% |
| apparel | 0.1% | 97.1% | 85% | 4% | 83.9% |
| arts crafts | 0% | 98.5% | 81.8% | 3% | 81.7% |
| automotive | 0.2% | 97.6% | 81.7% | 5.6% | 81.3% |
| baby kids | 0% | 98.6% | 83.5% | 1.6% | 83.3% |
| beauty | 0.3% | 95.8% | 84.2% | 8.3% | 82.8% |
| cbd wellness | 0% | 96.5% | 78.8% | 10.2% | 78.8% |
| electronics | 0.3% | 94.3% | 77.7% | 5% | 76.9% |
| eyewear | 0.1% | 98.7% | 79.5% | 3.4% | 79.3% |
| food beverage | 0.4% | 94.5% | 80.9% | 5.3% | 79.8% |
| footwear | 0.2% | 98.6% | 84% | 3.2% | 83.6% |
| garden plants | 0.1% | 97.8% | 82.6% | 5.6% | 82.2% |
| home | 0.3% | 97.2% | 84.9% | 7.4% | 84% |
| jewelry accessories | 0% | 100% | 71.7% | 2.8% | 71.7% |
| kitchen appliances | 0.2% | 98.2% | 81.9% | 5.6% | 81.3% |
| lingerie intimates | 0% | 98.4% | 66.9% | 2.2% | 66.9% |
| luggage bags | 0% | 97.6% | 73.2% | 2.2% | 73.2% |
| musical instruments | 0% | 98% | 59.3% | 2% | 59.3% |
| office stationery | 0% | 98.3% | 80.9% | 4.9% | 80.6% |
| outdoor sporting | 0.1% | 98% | 83.9% | 4.2% | 83.3% |
| pet | 0.3% | 97.9% | 80.1% | 5.1% | 79.8% |
| supplements | 0.4% | 96.7% | 80.7% | 12% | 80.2% |
| swimwear | 0% | 98.7% | 83.6% | 1.5% | 83.5% |
| tools hardware | 0.2% | 97.6% | 80.1% | 6.3% | 79.7% |
| toys games | 0.1% | 97.7% | 81.1% | 4.2% | 80.7% |
Agent-Ready rate
#81.5%
↑ 0.2 points (constant cohort of 59,450)
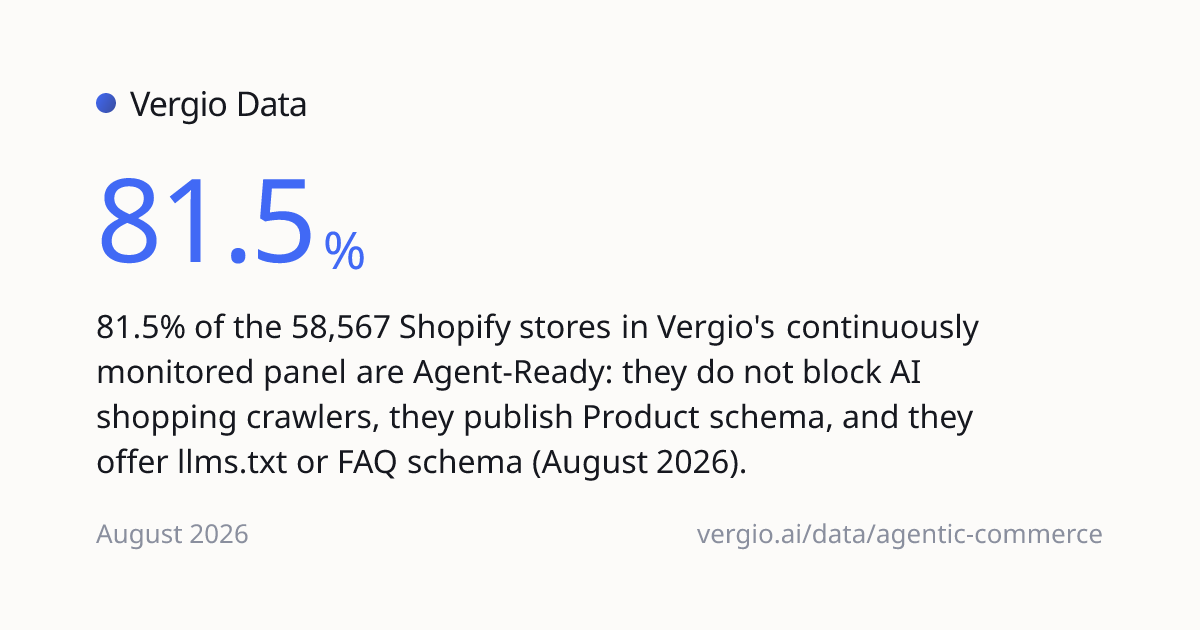
81.5% of the 58,567 Shopify stores in Vergio's continuously monitored panel are Agent-Ready: they do not block AI shopping crawlers, they publish Product schema, and they offer llms.txt or FAQ schema (August 2026).
Agent-Ready score distribution
#share of stores at each component count 0..4; denominator = stores definitive on ALL four facets (same as agent_ready_rate)
Based on 58,567 stores definitive on all four Agent-Ready checks (August 2026).
VACI over time
#2 months of published data.
Monthly notes
August 2026
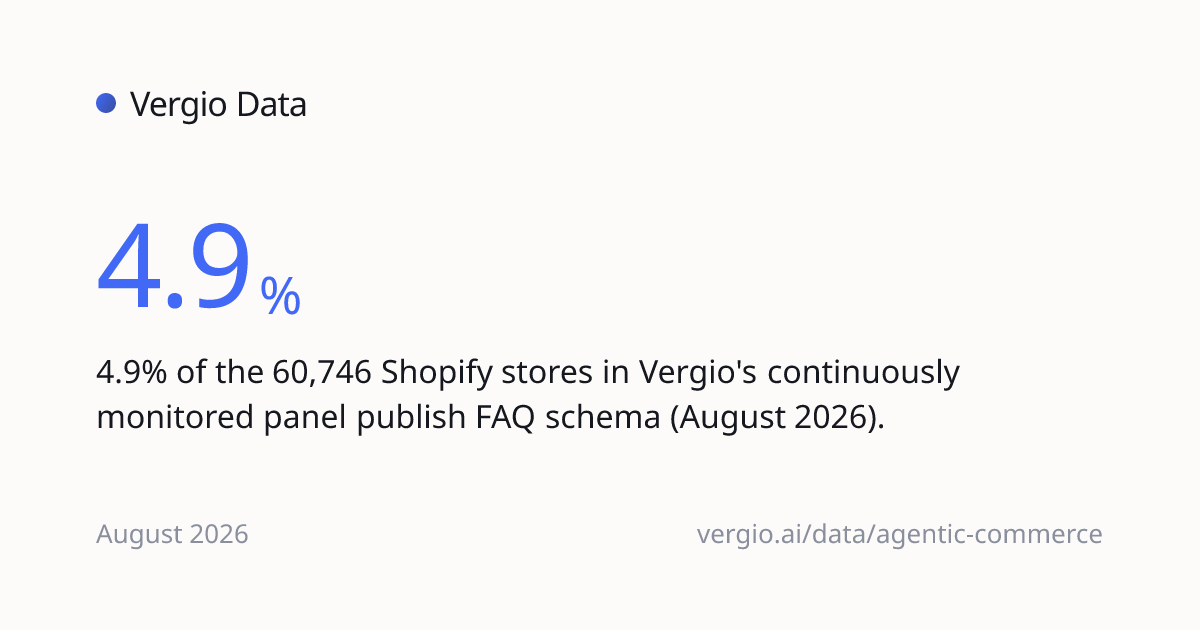
FAQ schema adoption moved from 4.7% to 4.9% (up 0.2 points, constant cohort)
2026
July 2026
Measurement update in July 2026: results before and after this point are not directly comparable. Details in the methodology changelog.
No material movement this month (change within the margin of error).
Frequently asked questions
Check your own store
Run a free check of any Shopify store against these same Agent-Ready facets.
Updated monthly since July 2026 · Data collected July 2, 2026 to August 31, 2026 · Methodology v1.0 · CC BY 4.0
All statistics and charts on this page are licensed CC BY 4.0. Reuse them freely with attribution to Vergio and a link to this page.